 Deutsch
  España
  Francais
  Polish
  Russian
  Čeština
  Greek
Greek  Lithuania
  Romanian
  Arabic
  Português
  Indonesian
  Croatian
  Serbia
  Farsi
Farsi  Hebrew
  Mongolian
  Bulgarian
  Georgia
  Azerbaijani
  Thai
Thai  Turkish
  Magyar
 Overview of test-progress information (dashboard)


In the Progress tab of the results, the teacher can see various useful details about how the test proceeded:
- students sorted by the speed of completing the test
- students sorted by success rate
- students sorted by the number of window exits
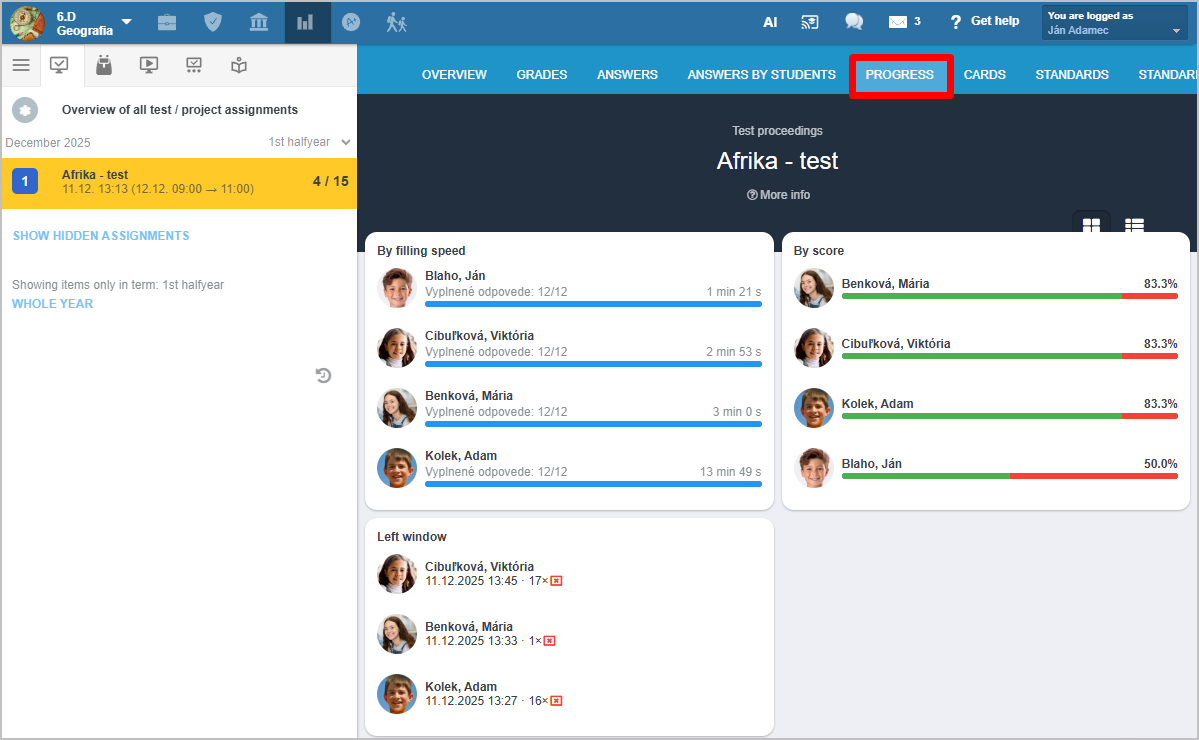
Below this, information is displayed for each individual student.
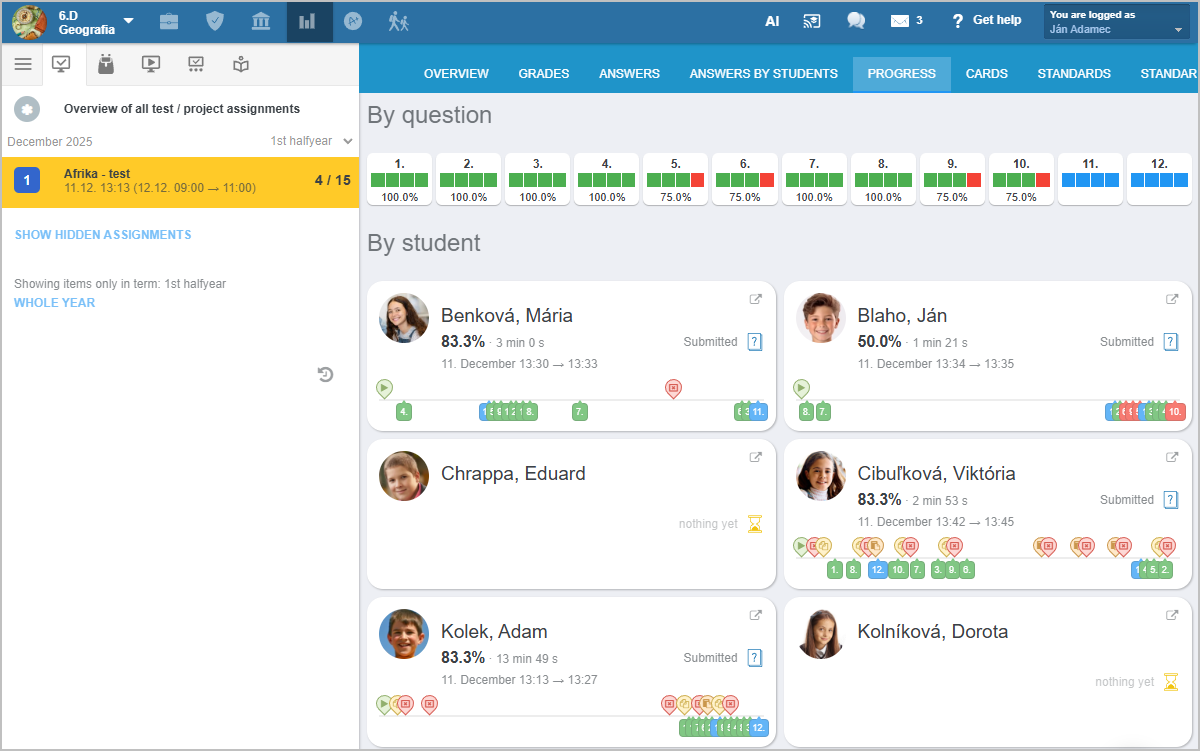
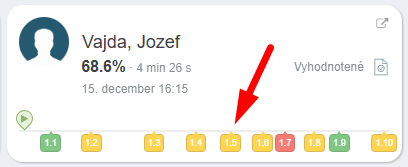
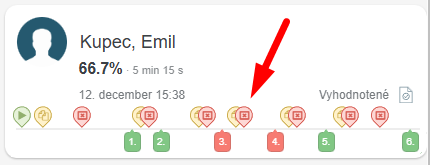
On the timeline, you can see how much time students spent on each question. You can also see correct (green), incorrect (red), and partially correct (yellow) answers.
Red icons indicate that the student left the test window. The reason for leaving the window is unknown — the student may have used a calculator, or perhaps Google or AI.
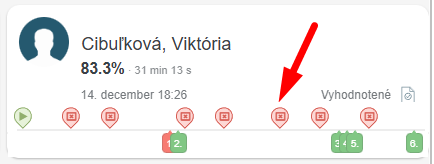
Yellow icons indicate that the student copied text from the test — for example, the question prompt. The student likely used an internet search engine or AI while solving the task.
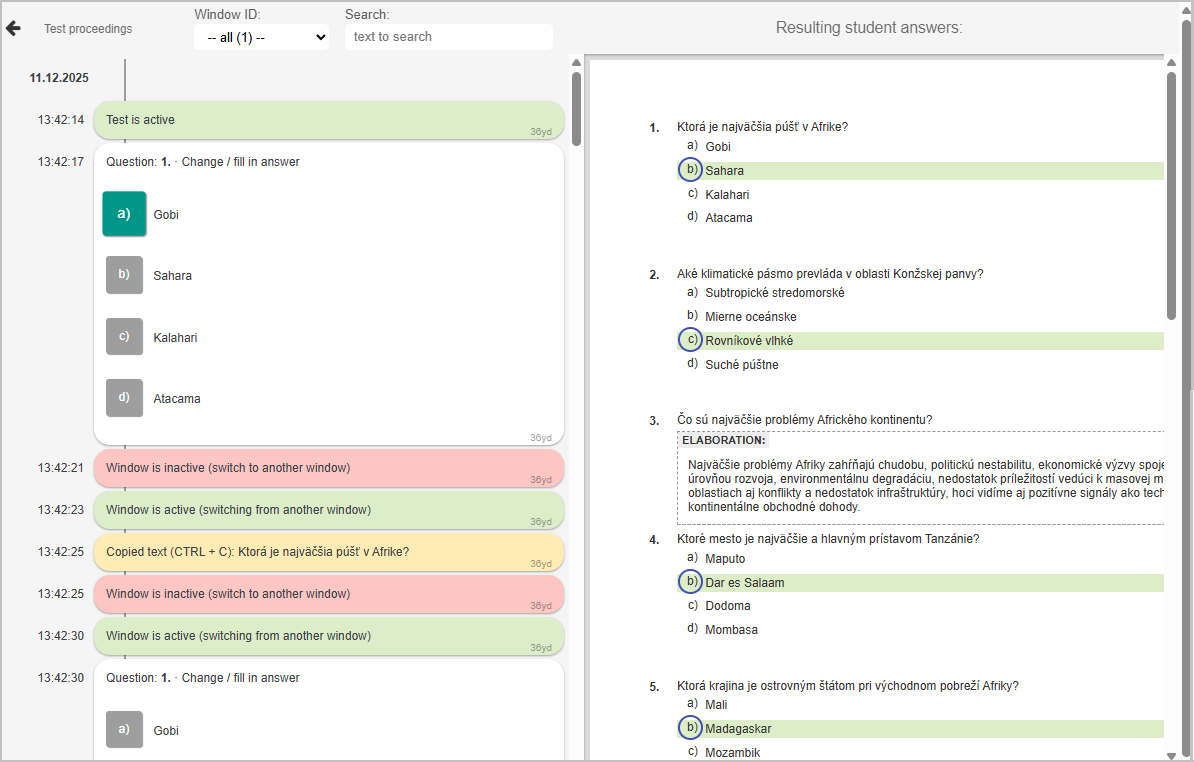
By clicking on a specific student, a log file with more detailed information opens. For example, in the picture we see that the student copied the text of the question at 13:42:25. He probably helped himself with the solution on the Internet.
More guides: Monitoring test progress, preventing cheating